 GOBLIXO
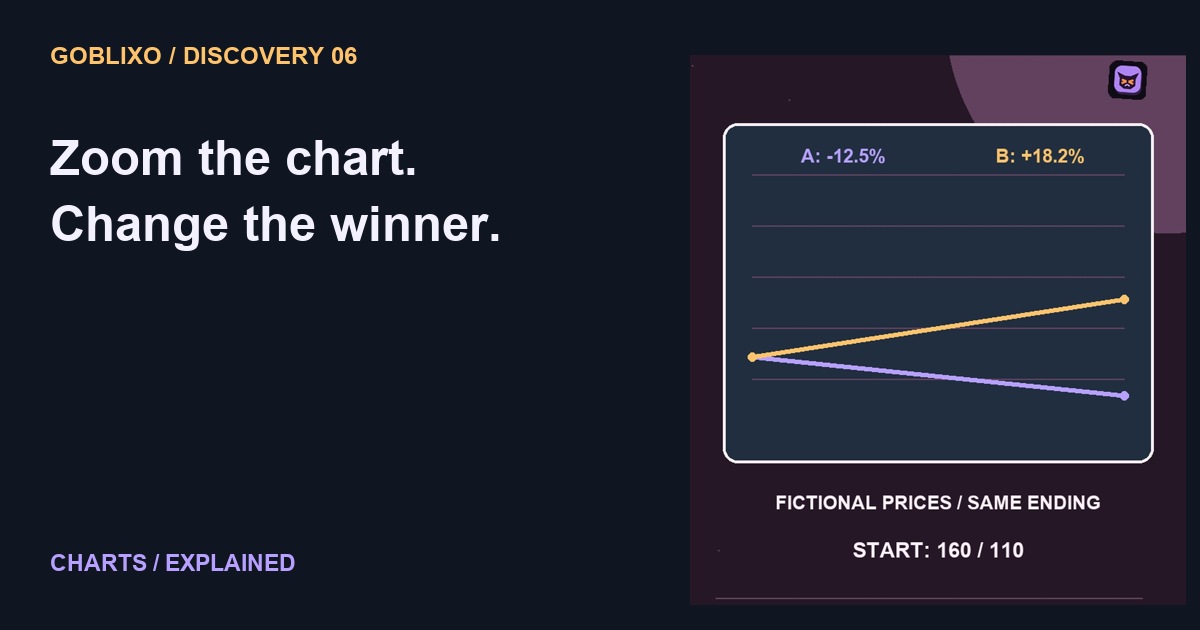
Same prices. new winner.
Two assets. One chart. You zoom in, and the apparent winner changes. Did the prices rewrite history? No. You changed the starting point of the comparison. Let us use invented prices.
The full window
Asset A starts at one hundred and ends at one hundred forty: up forty percent. Asset B starts at one hundred and ends at one hundred thirty: up thirty percent. In that window, A leads.
Now start later
Now begin later. At this new starting point, A is one hundred sixty, while B is one hundred ten. They finish at the same prices as before. We did not edit the ending.
Reset the baseline
From that later start, A falls twelve point five percent. B rises about eighteen point two percent. B now leads the percentage comparison. Different question, different answer.
The scale tells the story
TradingView's same percent comparison scale uses the first visible bar as the baseline. Scroll or zoom, and that starting point can change. The displayed percentages update for the visible period.
Compare the same question
Before sharing a winner screenshot, match the dates, symbols, data sources, and scale. A percentage line answers a return question for a chosen interval. It does not predict the next move.
Try the idea carefully
Reproduce the arithmetic before drawing a conclusion: percentage change equals ending value divided by starting value, minus one. Use the same units and window for both series. The invented paths demonstrate sensitivity to the baseline; they do not describe a live asset or a strategy. Comparing two lines also does not account for execution prices, fees, taxes, or what an investor actually held.